


How to Measure the Impact of Product Photography on eCommerce Sales
Product photography is one of the highest-leverage investments an eCommerce brand makes. It affects conversion rate, return rate, paid advertising performance, and organic engagement simultaneously. But most brands treat it as a cost rather than a measurable asset, which means they have no way of knowing whether their photography is working, where it is underperforming, or whether a planned upgrade will pay back its investment.
Measuring photography impact is not complicated. It requires knowing which metrics to track, where to find them on the platforms the brand actually uses, and how to isolate the visual variable from other factors that affect the same metrics.
Part of our complete guide: The Ultimate Guide to eCommerce Product Photography
The Metrics That Reflect Photography Performance
Four metrics directly reflect how photography is performing commercially. Each measures a different dimension of visual impact and each is available on every major eCommerce platform.
Conversion Rate
Conversion rate is the percentage of product page visitors who complete a purchase. It is the most direct measure of whether photography is building enough confidence to convert browsers into buyers.
Photography affects conversion rate through two mechanisms. First, the primary image determines whether a shopper clicks through from search results or a category page. A weak primary image loses the click before the shopper reaches the product page. Second, the gallery images determine whether a shopper who has arrived on the product page resolves enough uncertainty to add to cart. Missing angles, inaccurate color, or insufficient detail all create unresolved questions that prevent conversion.
Tracking conversion rate before and after a photography upgrade on the same product pages, over the same duration, with consistent traffic levels isolates the visual variable. The comparison needs to control for pricing changes, promotional activity, and seasonal variation to be meaningful.
Product Return Rate
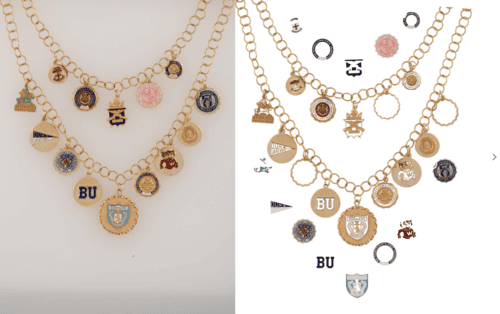
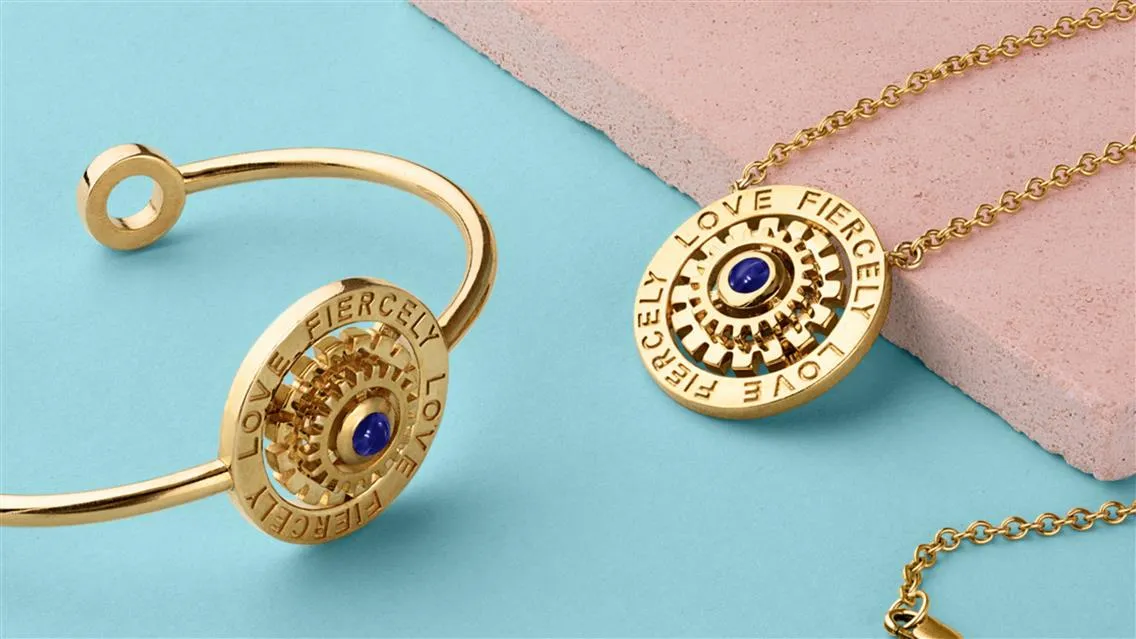
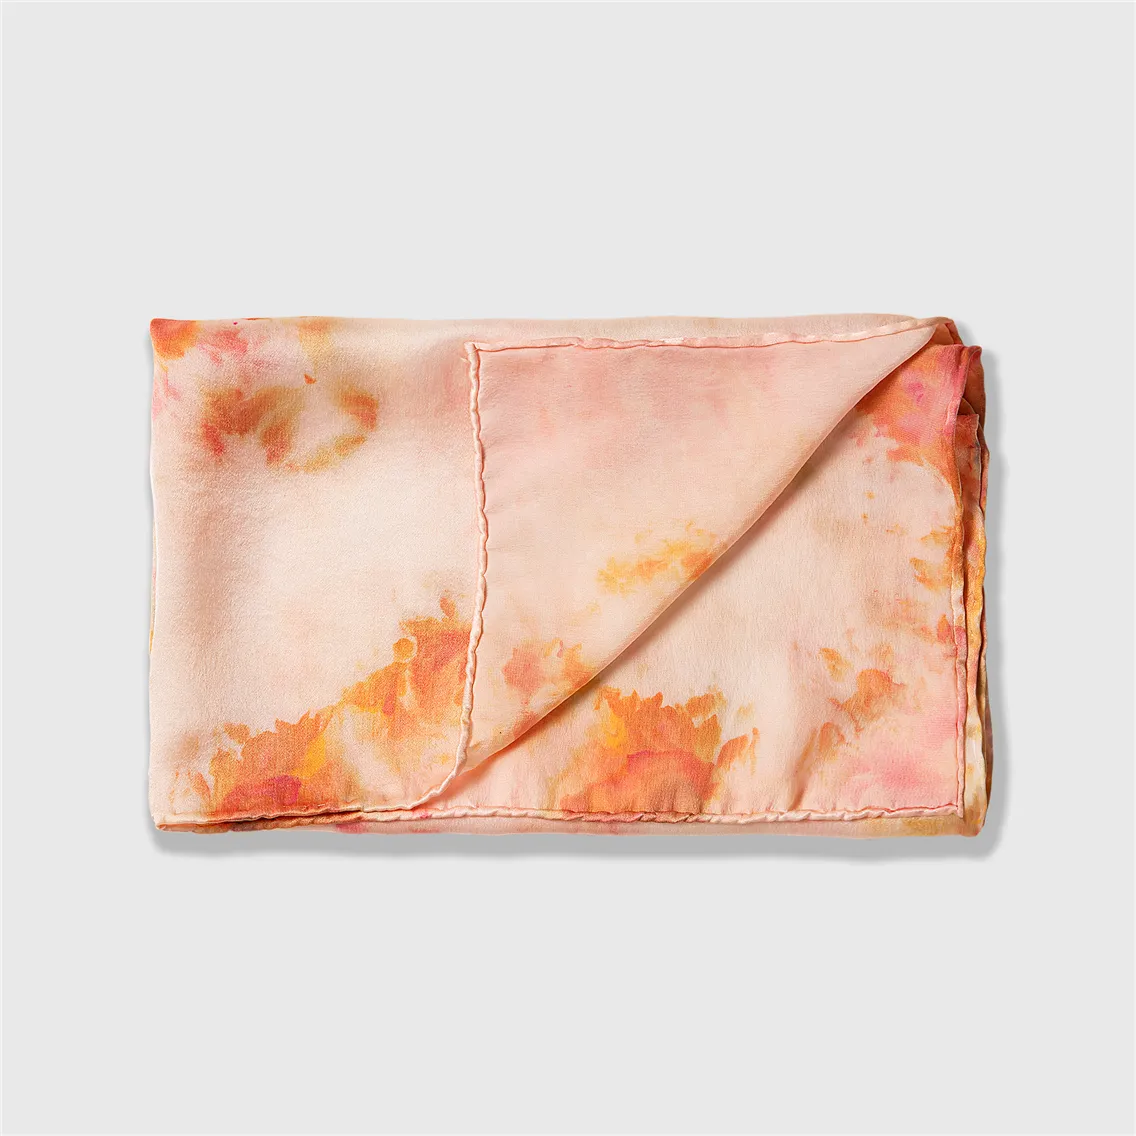
Return rate measures the percentage of orders that are returned. Photography accuracy is one of the primary drivers of returns. When customers receive products that look different from the images they purchased from, the visual expectation gap is the cause. This is particularly significant in apparel, accessories, jewelry, and home goods where color accuracy, scale, and texture all affect whether the received product matches the customer's expectation.
Tracking the reasons cited for returns identifies whether photography is contributing to return volume. Returns attributed to "not as described," "color different than shown," or "size different than expected" are all photography accuracy problems rather than product quality problems.
For how photography accuracy connects to return rates specifically: Reducing Product Return Rates Through Accurate Photography
Engagement Metrics
Engagement metrics reflect how effectively photography holds attention once a visitor arrives on a product page. The relevant signals are bounce rate, average session duration, and pages per session.
Lower bounce rates indicate that photography is engaging enough to keep visitors on the page rather than immediately leaving. Longer session durations indicate that visitors are spending time examining images, reading descriptions, and considering the product seriously. More pages per session indicate that the photography is creating enough brand interest to drive exploration of other products.
These metrics do not directly measure purchase intent but they reflect the depth of engagement that typically precedes conversion. A product page with strong photography will show longer session durations and lower bounce rates than an equivalent page with weak photography, all else being equal.
Click-Through Rate (CTR)
Click-through rate measures the percentage of people who see a product in search results, a category page, or an advertisement and click through to the product page. Photography is the primary determinant of CTR because it is the first and most prominent element in most listing formats.
For paid advertising specifically, CTR has direct financial implications. A higher CTR reduces cost per click and improves return on ad spend. The same photography that converts on a product page also determines whether the paid traffic gets to the page in the first place.
Return on Investment (ROI), ROMI, and ROAS
Conversion rate, return rate, engagement, and CTR are all leading indicators. ROI, ROMI, and ROAS are the financial outcome metrics that translate those indicators into a business case.
ROI (Return on Investment) measures the net financial return from the photography investment relative to its cost. The calculation compares revenue generated by upgraded product pages against the cost of the photography production. The worked example in the ROI calculation section below shows how to run this calculation for a specific product set.
ROMI (Return on Marketing Investment) applies specifically to photography used in marketing contexts: paid advertising, email campaigns, social media, and organic content. Where ROI measures the direct revenue impact on product pages, ROMI measures the efficiency of photography as a marketing asset. A primary image upgrade that improves paid social CTR by 40% reduces cost per click by the same proportion across the entire advertising budget allocated to that product, which can represent a significantly larger financial impact than the product page conversion improvement alone.
To calculate ROMI for photography used in paid advertising: take the revenue attributable to the campaigns using the upgraded images, subtract the campaign spend and the photography cost, and divide by the total cost. Compare this against the same calculation for campaigns using the previous images over the equivalent period.
ROAS (Return on Ad Spend) measures revenue generated per dollar of advertising spend. Photography quality directly affects ROAS through two mechanisms. First, a stronger primary image generates higher CTR, which means more of the ad spend reaches product pages rather than being consumed by impressions that do not convert to clicks. Second, a stronger product page gallery converts a higher percentage of the paid traffic that arrives, which means more revenue per dollar of spend.
Tracking ROAS before and after a photography upgrade on the same ad campaigns, with consistent budgets and targeting, isolates the visual contribution to advertising efficiency. For Amazon specifically, the Advertising Console in Seller Central shows ROAS per campaign and per ASIN, making before and after comparison straightforward.
Where to Find These Metrics by Platform
DTC Websites and GA4
Setting up photography-specific tracking in GA4 — GA4 event tracking can capture product image interactions including zoom, image gallery clicks, and image carousel navigation. These events require implementation through Google Tag Manager or direct GA4 event configuration. Once configured, the data shows which products are generating the highest image engagement and whether image interaction correlates with conversion.
Explorations — GA4's Explorations feature allows custom analysis comparing product pages with high image engagement against those with low image engagement to identify correlation with conversion rate. Build a funnel exploration using product page view, image interaction, add to cart, and purchase as the funnel steps to see where drop-off is occurring and whether image engagement is a predictor of conversion completion.
Heatmap integration — Hotjar and Microsoft Clarity (free) integrate directly with GA4 and Shopify. Both provide scroll maps showing how far visitors scroll on product pages, click maps showing which elements receive the most interaction, and session recordings showing how individual users engage with product images. These tools identify whether visitors are engaging with secondary images or stopping at the primary image, which directly informs which images need improvement.
Shopify
Conversion rate — in the Shopify admin, navigate to Analytics then Reports then Sales by product. This shows units sold and sessions for each product, from which conversion rate can be calculated. The date range selector allows direct comparison between periods before and after a photography update. For more granular data, connect Google Analytics 4 to the Shopify store and use the eCommerce events report to see conversion rate per product page.
Return rate — Shopify does not calculate return rate natively. Returns are tracked through the Refunds section in Orders. Export order and refund data for a defined period, calculate return volume as a percentage of total orders, and filter by product or category to identify which SKUs are driving returns. The Notes field on refund requests often captures the customer-stated reason, which identifies whether returns are linked to visual expectation gaps.
Engagement metrics — Google Analytics 4 connected to the Shopify store provides bounce rate, session duration, and pages per session per product page. In GA4, navigate to Reports then Engagement then Pages and screens, filter by product page URLs, and compare engagement metrics across products and time periods.
A/B testing images — Shopify's native testing functionality is limited. Third-party apps including Neat A/B Testing, PageFly, and Shoplift allow product page image A/B testing with conversion tracking. Each requires installation from the Shopify App Store and configuration before testing can begin.
For Shopify product photography strategy: How to Set Up Product Photography for Your Shopify Store
Amazon
Click-through rate and conversion rate — in Amazon Seller Central, navigate to Brand Analytics then Search Catalog Performance. This report shows impressions, clicks, and purchases per ASIN, from which CTR and conversion rate can be calculated directly. The report is available for Brand Registry accounts only.
Manage Your Experiments — Amazon's native A/B testing tool for primary product images. Available under Brand Content in Seller Central for Brand Registry accounts. The tool allows testing two versions of a primary image against each other with statistical significance tracking. Results are typically available after four weeks with sufficient traffic volume.
Return rate — in Seller Central, navigate to Reports then Fulfillment then Customer Returns. This report shows return volume per ASIN with the customer-selected return reason. Reasons including "inaccurate website description" and "item defective or doesn't work" often reflect photography accuracy problems rather than product defects. Filtering by ASIN and comparing return rates before and after photography updates isolates the visual impact.
Search Term Report — available under Reports then Advertising Reports in Seller Central. This report shows which search terms are generating impressions and clicks for each ASIN. A photography upgrade that improves CTR will show an increased click volume per impression across the most important search terms.
For Amazon listing photography strategy: How to Optimize Your Amazon Listing: Photos, Video, Infographics, and Product Descriptions
For diagnosing Amazon listing performance problems: 5 Reasons Your Amazon Sales Have Slowed Down
Etsy
Conversion rate and traffic — in Etsy's Shop Manager, navigate to Stats. The dashboard shows views, visits, orders, and conversion rate per listing over selected date ranges. The individual listing stats page shows traffic sources and the search terms driving impressions and clicks. A photography upgrade that improves thumbnail appeal will show an increase in clicks relative to impressions, visible as an improved click-through rate within the listing stats.
Return rate — Etsy tracks returns and cases through Shop Manager under Orders and Delivery. Cases opened citing "item not as described" are the most direct photography accuracy signal. Monitoring case volume per listing before and after photography updates identifies whether visual accuracy improvements are reducing dispute rates.
Review sentiment — Etsy reviews frequently reference visual accuracy. Filtering reviews for mentions of color, size, and appearance provides qualitative data that complements the quantitative stats. A pattern of reviews mentioning that the product looks different from the photos is a clear signal that photography accuracy needs attention.
For Etsy photography strategy and what performs best on the platform: How the Right Product Photography Drives Sales on Etsy
Practical Methods to Precisely Measure Your Catalog Photography’s Impact
A/B Testing for Product Images
A/B testing isolates the visual variable by showing two versions of the same product page to different segments of visitors simultaneously and measuring conversion outcomes for each version.
What to test
Test one variable at a time. The most commercially significant tests are primary image angle (straight-on versus three-quarter view), background choice (pure white versus off-white versus lifestyle), on-model versus ghost mannequin for apparel, and number of gallery images.
Testing multiple variables simultaneously makes it impossible to attribute results to a specific change. A test that changes the primary image, adds three new gallery images, and switches from ghost mannequin to on-model at the same time cannot isolate which change drove the result.
Sample size and duration
A/B tests on product pages require sufficient traffic to produce statistically reliable results. As a practical guideline, each variant needs at least 200 conversions to produce results with reasonable statistical confidence. For lower-traffic product pages, achieving this threshold may take four to eight weeks. For high-traffic pages, two weeks may be sufficient.
Running a test for too short a period produces unreliable results that reflect day-of-week variation or short-term traffic fluctuations rather than genuine performance differences. Running a test during an atypical period, a promotional sale, a seasonal peak, or a period of unusual ad spend, produces results that cannot be attributed to the visual change.
Tools for A/B testing images
Amazon Manage Your Experiments is the most straightforward option for Amazon sellers with Brand Registry. The tool is built into Seller Central and handles statistical significance tracking automatically.
Google Optimize (free) integrates with GA4 and most website platforms for DTC testing. It requires technical implementation but provides full control over test design and reporting.
Optimizely and VWO are enterprise-level testing platforms with more sophisticated targeting and reporting capabilities. Both are appropriate for brands with high traffic volumes and dedicated optimization resources.
Shopify-native apps including Neat A/B Testing and Shoplift are the lowest-friction options for Shopify stores. Both install from the App Store and handle implementation without requiring developer resources.


Calculating Photography ROI
Photography investment justification is straightforward when the measurement framework is in place. The calculation requires four inputs: the cost of the photography upgrade, the baseline conversion rate before the upgrade, the conversion rate after the upgrade, and the average order value.
A worked example: a brand spends $3,000 upgrading photography for ten SKUs. Before the upgrade, those product pages convert at 2.5% across 10,000 monthly sessions. After the upgrade, conversion rate improves to 3.2% across the same traffic volume. At an average order value of $85, the calculation runs as follows.
Before: 10,000 sessions at 2.5% conversion rate produces 250 orders. At $85 average order value, monthly revenue from those pages is $21,250.
After: 10,000 sessions at 3.2% conversion rate produces 320 orders. At $85 average order value, monthly revenue is $27,200.
Monthly revenue increase: $5,950. Photography investment: $3,000. Payback period: approximately 15 days. Every subsequent month generates $5,950 in additional revenue from the same traffic, compounding as long as the photography remains current.
This calculation does not include the reduction in return processing costs from improved photography accuracy, the improvement in paid advertising efficiency from higher CTR, or the organic ranking benefits from improved engagement metrics. All three add to the total return.
Heatmaps and Behavioral Data
Conversion rate and return rate measure outcomes. Heatmaps and session recordings reveal the behavior that produces those outcomes.
Scroll depth maps show how far visitors scroll on a product page. If most visitors are not scrolling past the primary image, secondary images are not being seen regardless of their quality. This data identifies whether the page structure is preventing image engagement rather than the images themselves being the problem.
Click maps show which elements on the product page receive the most interaction. For product photography specifically, this reveals whether visitors are clicking into the gallery, whether they are using the zoom function, and whether specific images are generating more interaction than others.
Session recordings show how individual users move through a product page. Watching recordings of visitors who abandoned without converting often reveals specific friction points: a visitor who zooms into an image and immediately leaves may be encountering a quality or accuracy problem that the zoom reveals. A visitor who scrolls through all gallery images and then returns to the primary image before leaving may be looking for a specific angle or detail that is not present.
Hotjar and Microsoft Clarity are the two most widely used heatmap tools for eCommerce. Clarity is free with no session recording limits. Hotjar's free tier allows limited session recordings with paid plans for higher volumes. Both integrate with Shopify, WooCommerce, and most website platforms through a simple script installation.
5 Common Measurement Mistakes
1. Testing during atypical periods
A photography A/B test run during a sitewide sale, a major promotional campaign, or the holiday peak season produces results contaminated by factors unrelated to the visual change. Conversion rates are elevated across the board during promotional periods, which masks the true impact of photography improvements. Test during periods of normal traffic and normal conversion behavior.
2. Not controlling for other changes
A photography upgrade that coincides with a price change, a description update, or a change in advertising spend cannot isolate the visual variable. Document all changes made to a product page during a test period and pause the test if other significant changes are made simultaneously.
3. Measuring too early
Conversion rate fluctuates day to day and week to week based on traffic composition, day of week, and external factors. Measuring the impact of a photography upgrade after three days produces noise, not signal. Allow at least two weeks of consistent traffic before drawing conclusions, and four weeks for lower-traffic products.
4. Focusing only on desktop data
A significant proportion of eCommerce browsing and purchasing happens on mobile devices. Photography that performs well at full desktop resolution may perform differently at mobile scale, particularly if key product details require zooming to see clearly. Always segment measurement data by device type and optimize images for mobile viewing as a standard production requirement, not an afterthought.
5. Ignoring qualitative signals
Quantitative metrics show what is happening. Customer feedback shows why. Product reviews, post-purchase surveys, and customer service conversations that reference visual expectations provide the context that explains why conversion rate or return rate moved in a particular direction after a photography update. Both data types are needed for a complete picture.
Using Measurement to Brief Future Productions
The data generated from photography performance measurement is the most valuable input for the next production brief. Visual styles that consistently produce higher conversion rates should be prioritized in future shoots. Product categories with high return rates attributed to visual expectation gaps need photography that is more accurate and more comprehensive in angle coverage. Gallery images that generate high zoom interaction indicate that customers want more detail in that area of the product.
Bringing this data to a production brief transforms the photography commission from a creative preference conversation into a commercial performance conversation. The studio understands what the images need to accomplish commercially, not just what they need to look like aesthetically.
For how to evaluate whether photography budget is being allocated effectively across the catalog see: How to Get More From Your Photography Budget
For how visual performance connects to the broader marketing strategy see: Visual Marketing Strategy for eCommerce Brands


